Granular Flow of CAM-28 Particles down Rough Inclined Surfaces
Rishabh Datta is a 4th Year Mechanical Engineering student at Georgia Tech, Atlanta. Rishabh is interested in Green Technology, Renewable Energy, Data Science, and CFD. For more projects, click here.
Exploring the Reduction of Perovskite Oxides in a Continous Flow Solar Reactor
Introduction
CAM-28 (Calcium Manganate doped with Aluminum) is an example of a Perovskite Oxide. Perovskite Oxides are of the form and undergo reduction at high temperatures to yield oxygen. Perovskite oxides are of special interest in thermochemical energy storage using concentrated solar power to produce solar fuels, because they exhibit good cyclability and high reduction temperatures (which means more energy is stored as sensible heat and enthalpy). This project explores the suitability of CAM-28 particles for use in a 5 kW laboratory-scale solar thermochemical reactor, the Solar Thermochemical INclined Granular-flow Reactor (STINGR). In the STINGR, reactants are continuously fed, and flow down a rough slope, where they are exposed to irradiation. As such, granular flow of CAM-28 is examined to determine average velocity and residence times of flow in the reactor.
This project was completed at the Solar Fuels Laboratory, Georgia Tech, under the supervision of Dr. Peter Loutzenhiser.
Granular Flow down Rough Inclined Surfaces
For a rough surface, uniform flow occurs for a range of inclinations for which the shear force acting on the particles balances the gravitational force. During such flow, a no slip condition is established, which means that the relative velocity between the surface and the layer of particles adjacent to the surface is zero. Critical thickness hstop is the thickness of the granular layer when no motion occurs, and layer height h is the layer thickness during flow. The flow line equation for characteristic length L and particle diameter d has been determine to be:
The velocity profile can then be determined as a function of inclination angle and layer thickness. In general, for steady uniform flow, mean velocity ū increases with an increase in inclination angle and layer thickness. Mean velocity can be related to the ratio of layer thickness and critical thickness using the following formula:
and
are experimentally determined fitting coefficients.
Methodology
Particle flows were tested on 300 mm x 150 mm alumina slopes. The surfaces were mounted on an adjustable tilt-rig. Particles were then allowed to flow down each set of test surfaces at different inclination angles. Images of the flow were captured using the Photron SA-3 FASTCAM high speed camera. Average velocity of flow was determined using Particle Image Velocimetry (PIV), and layer height and layer thickness were determined optically, by determining the displacemnet of a laser beam on the slope.
Results
CAM-28 particles demonstrated uniform flow for . Flow of CAM-28 at
was found to be ideal for use in the STINGR, as the flow exhibited good residence times and left a thin layer of residue (small
) after flow was stopped.
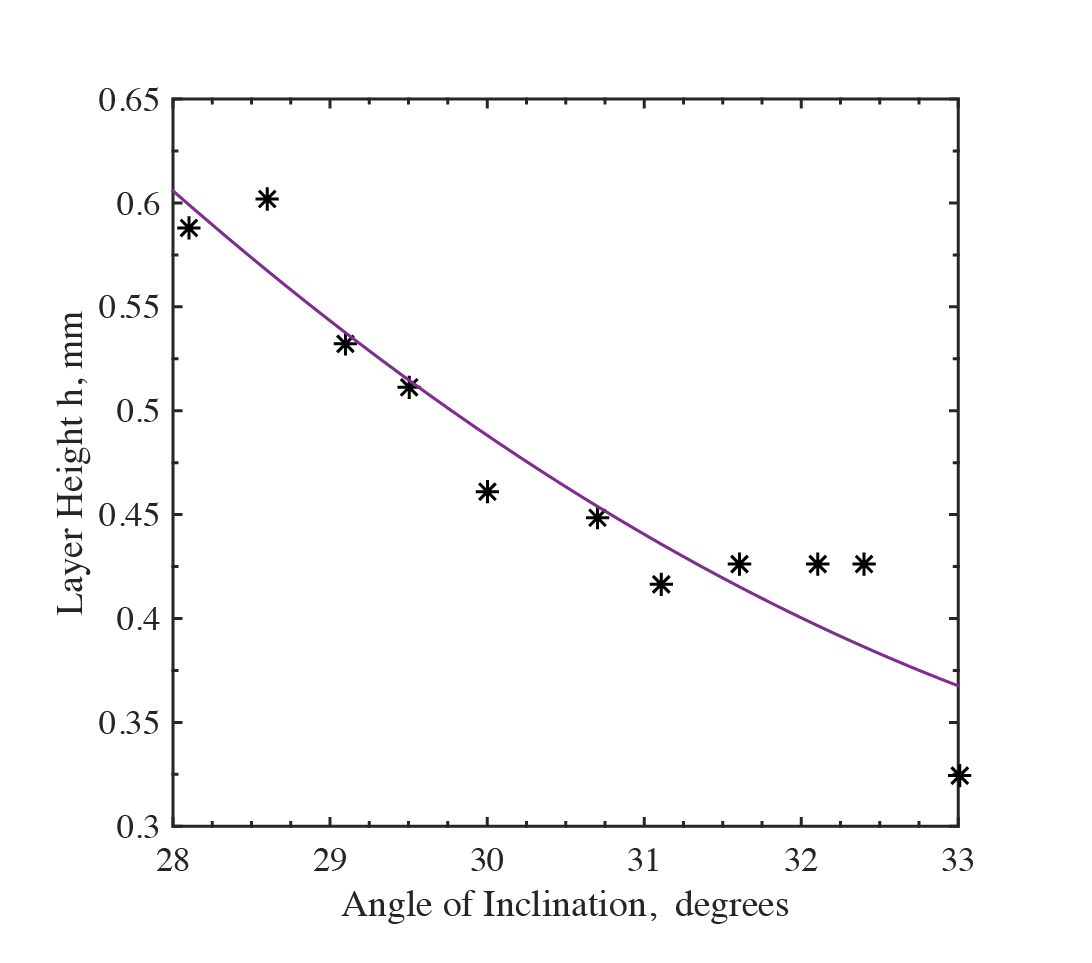
Figure 1: layer height with angle of inclination
Layer height was observed to decrease with an increase in angle of inclination. This is because for the same mass flow rate, the increase in average velocity (due to steeper slope) causes a decrease in the height of the flowing bed.
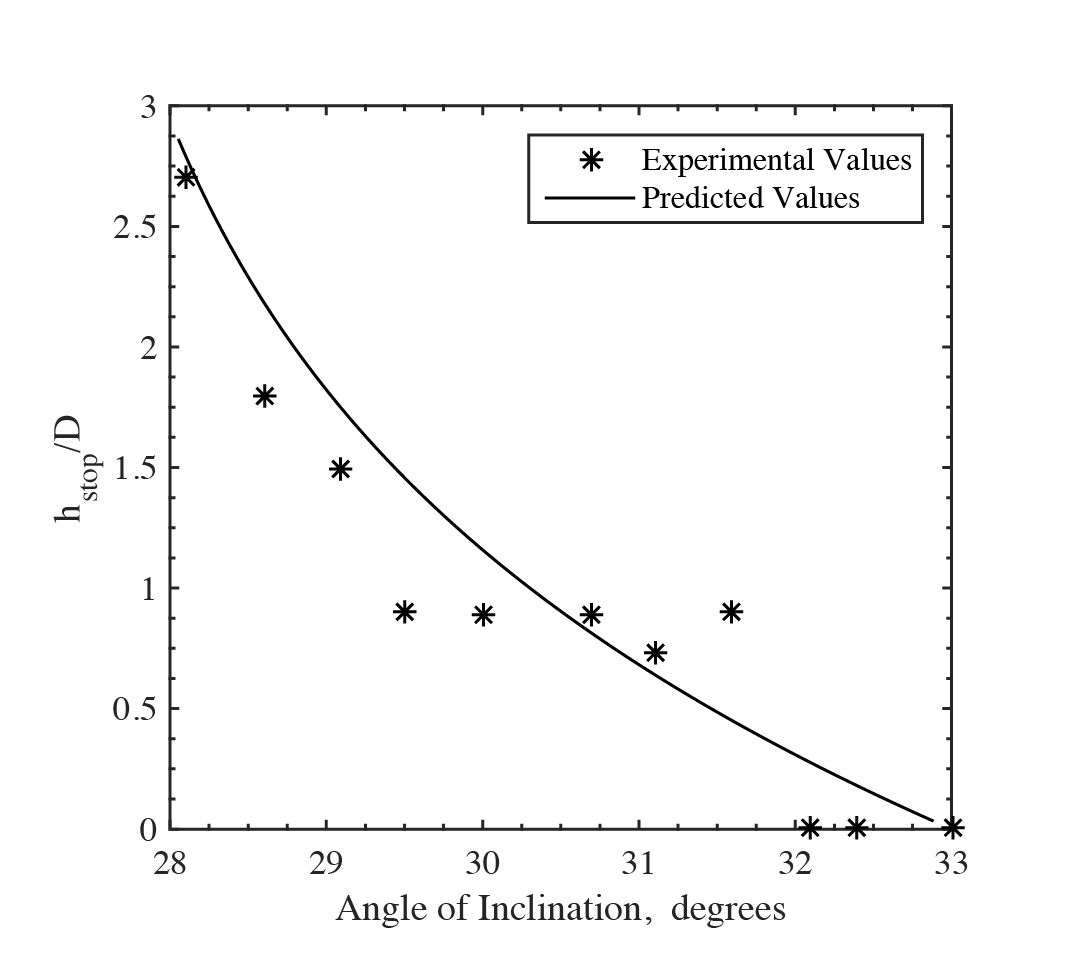
Figure 2: Variation of hstop with the angle of inclination
Figure 2 shows the variation of critical thickness with the angle of inclination, as well as the expected variation obtained from the flow line equation. The experimental values of fit the model well for shallower angles, but demonstrate significant noise at steeper angles, for which the image processing method used to determine h and hstop was less accurate. Moreover, the values of h obtained were found to underestimate the volume fraction of the packed bed. The volume fraction of packed beds is expected to be ~0.6, but the values obtained were found to be in the range .
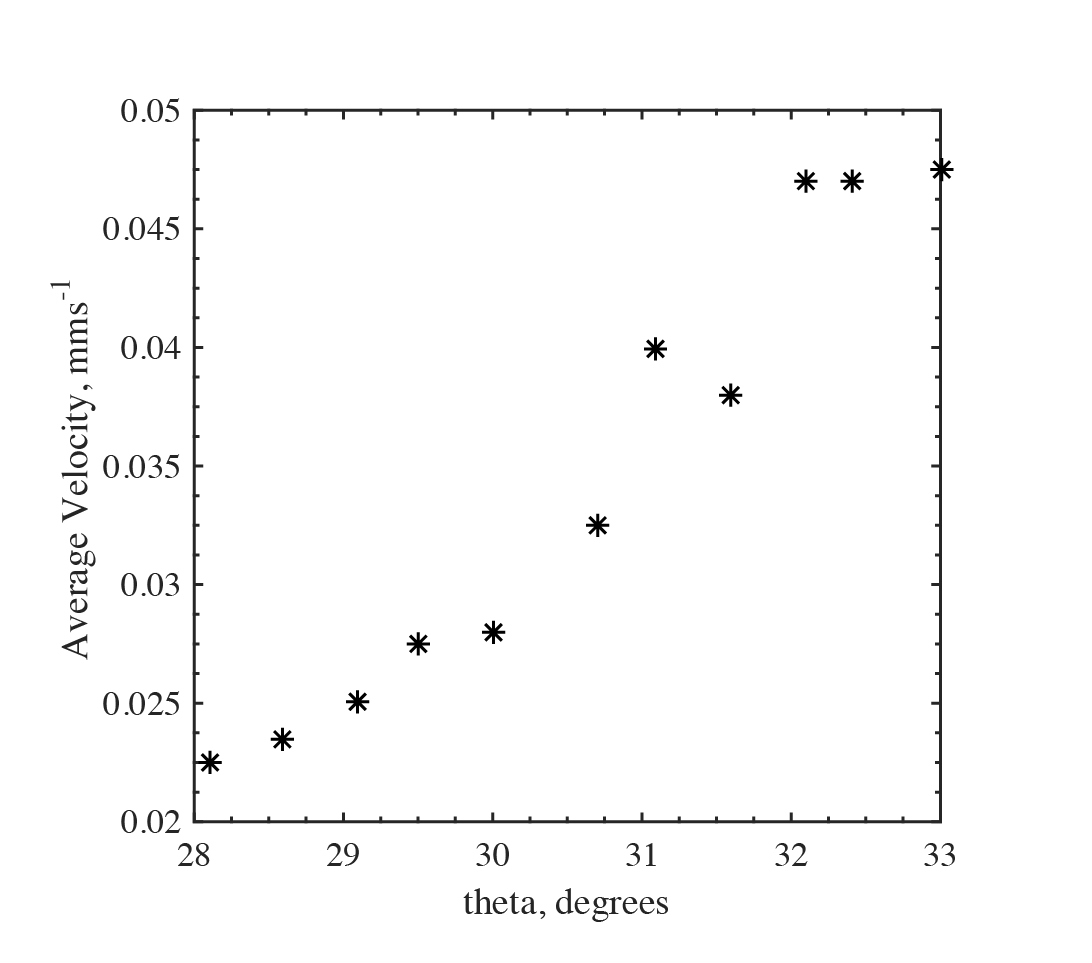
Figure 3: Variation of the average velocity with the angle of inclination
Figure 3 shows the variation of the average velocity with the angle of inclination, determined using particle image velocimetry. As expected, the average velocity was seen to increase with an increase in angles of inclination. These values were used to determine the variation of Froude Number with , as shown in Figure 4.
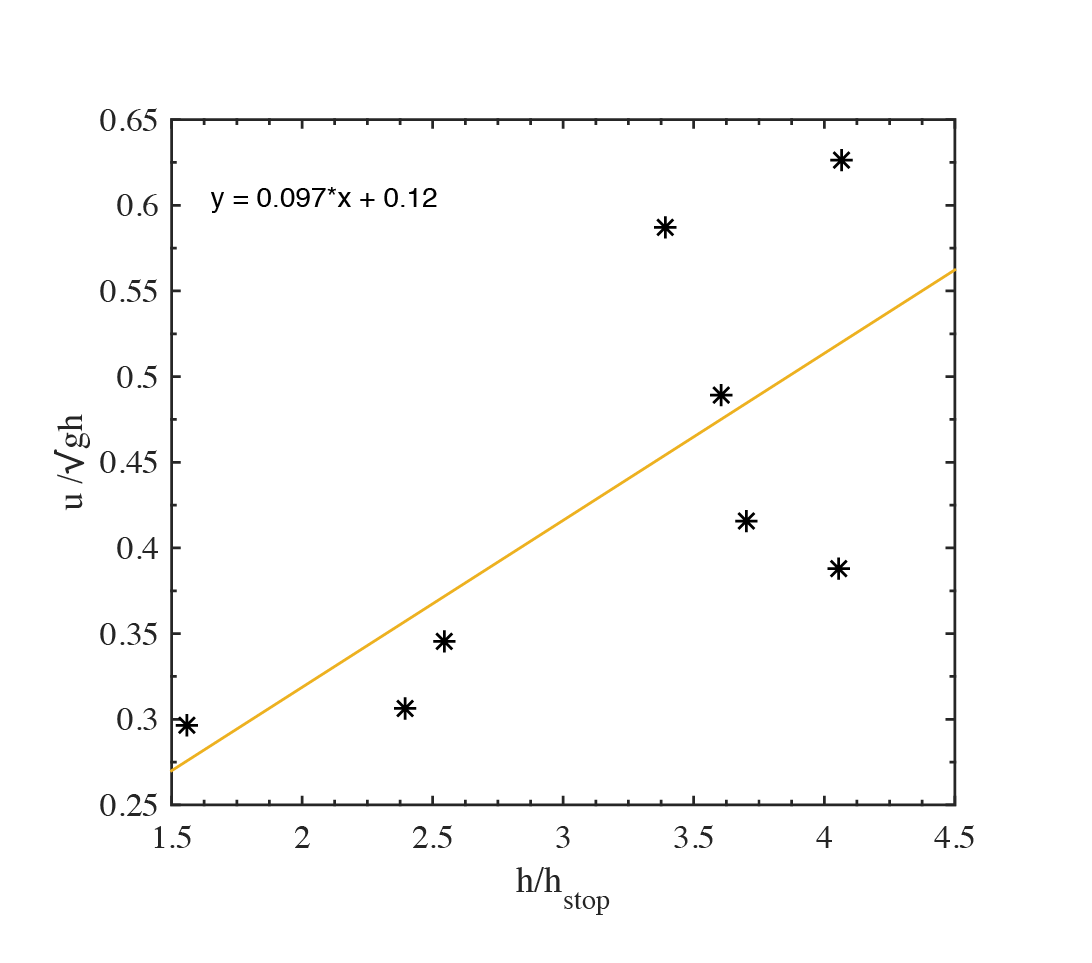
Figure 4: Variation of Froude Number with h/hstop
From a linear fit the value of was found to be 0.097. The expected value is 0.136 (Pouliquen, 1999). The data also exhibits significant noise, especially at steeper angles. This may be attributed to the low accuracy of the method used at these steeper angles. A more reliable method of determining small changes in displacement could be used. A laser displacement sensor with high precision can be mounted on a rail and slid across the surface to detect the average height of the surface during and after flow.