Measurement of Displacement of Laser during Flow using a RANSAC Algorithm
Rishabh Datta is a 4th Year Mechanical Engineering student at Georgia Tech, Atlanta. Rishabh is interested in Green Technology, Concentrated Solar Power, Renewable Energy, Data Science, and CFD. For more projects, click here.
Determining Displacement during Granular Flow using Optical Methods
MATLAB Code used in this project
Displacement Measurement Script
Overview
The objective of this project is to experimentally determine the layer height h for granular flow of particles down rough inclined surfaces optically from images of the flow. A laser beam was positioned to shoot a cross-beam across the surface. The set-up is shown below.
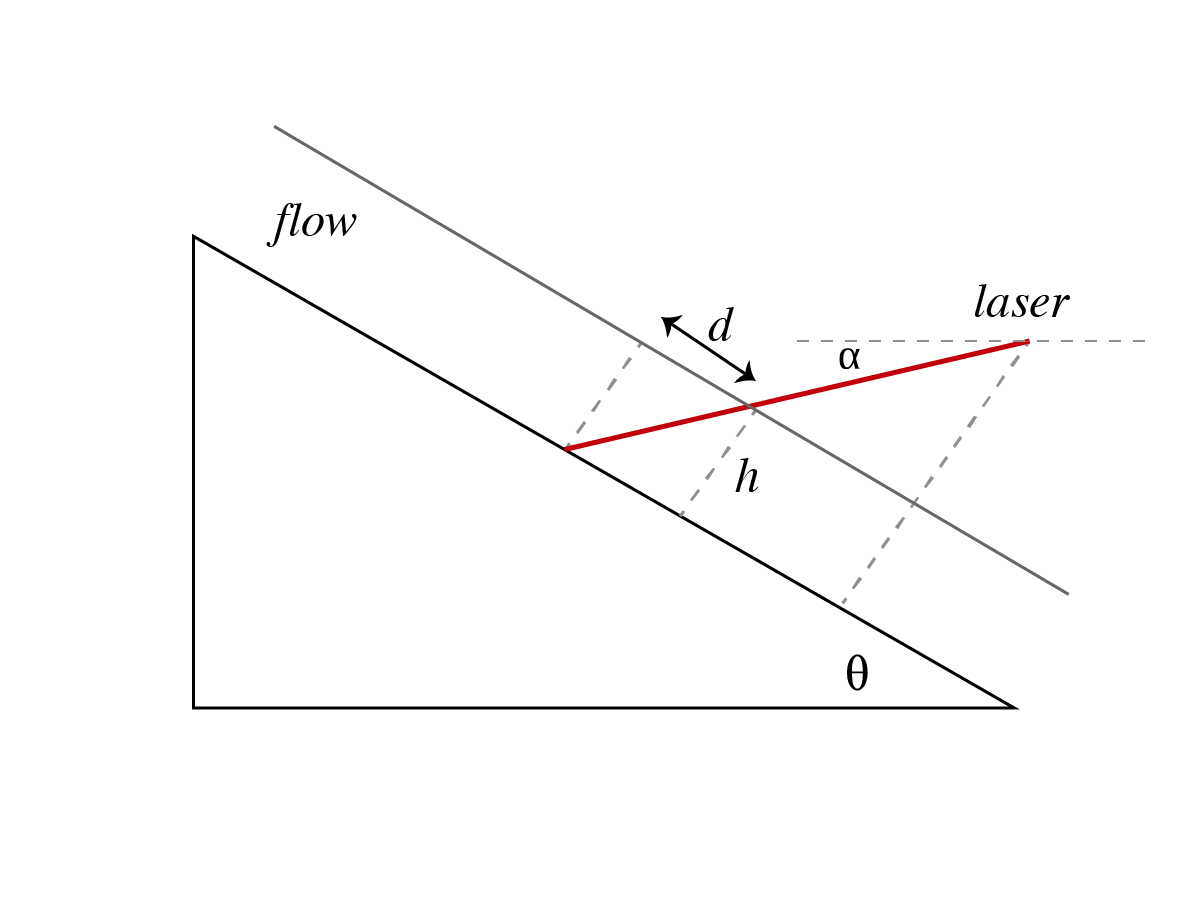
Figure 1: Experimental Set-Up
Layer height can be determined from the displacement of the laser on the surface during flow using the following relationship.
The displacement of the laser beam on the surface was determined by fitting a second order curve to the beam, using the Random Sample Concensus (RANSAC) Algorithm. The RANSAC algorithm is useful in fitting curves to a data set in the presence of outlers. The RANSAC algorithm works by picking a random sample from the dataset. A curve is then fit to the sample. Outliers are identified dy comparing the distance of a point to the fitted model. The process is repeated iteratively, to maximize the number of inliers to obtain the best regression model.
This project was completed at the Solar Fuels Laboratory, Georgia Tech, under the supervision of Dr. Peter Loutzenhiser.
Methodology
Images before flow (Control Image) and during flow (Test Image) were captured and converted into greyscale images. The points illuminated by the laser beam were then identified by setting a brightness threshold. The coordinates for the laser beam were then fed into a RANSAC fitting function, which fit a second order curve to the input data. The RANSAC fitting function used in this code was written to fit curves of a desired order to the given data.
This project uses the RANSAC method, but it has been modified to supplement image processing methods used. In addition, the best regression model is determined using all inliers, instead of the minimum number of points needed for a given order fit.
The average displacement was then determined by comparing the distance between the two curves of best fit between the control and test images.
Results
The raw control and test images used for this project are shown below.
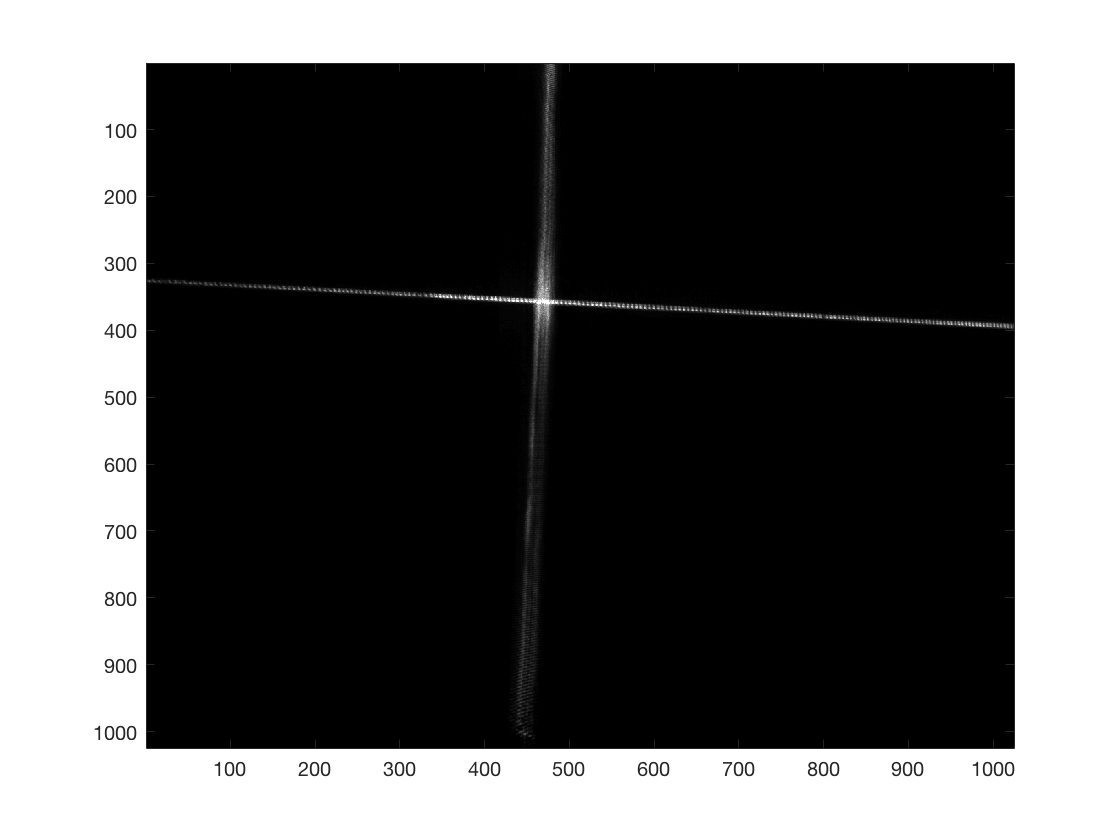
Figure 2: Control Image
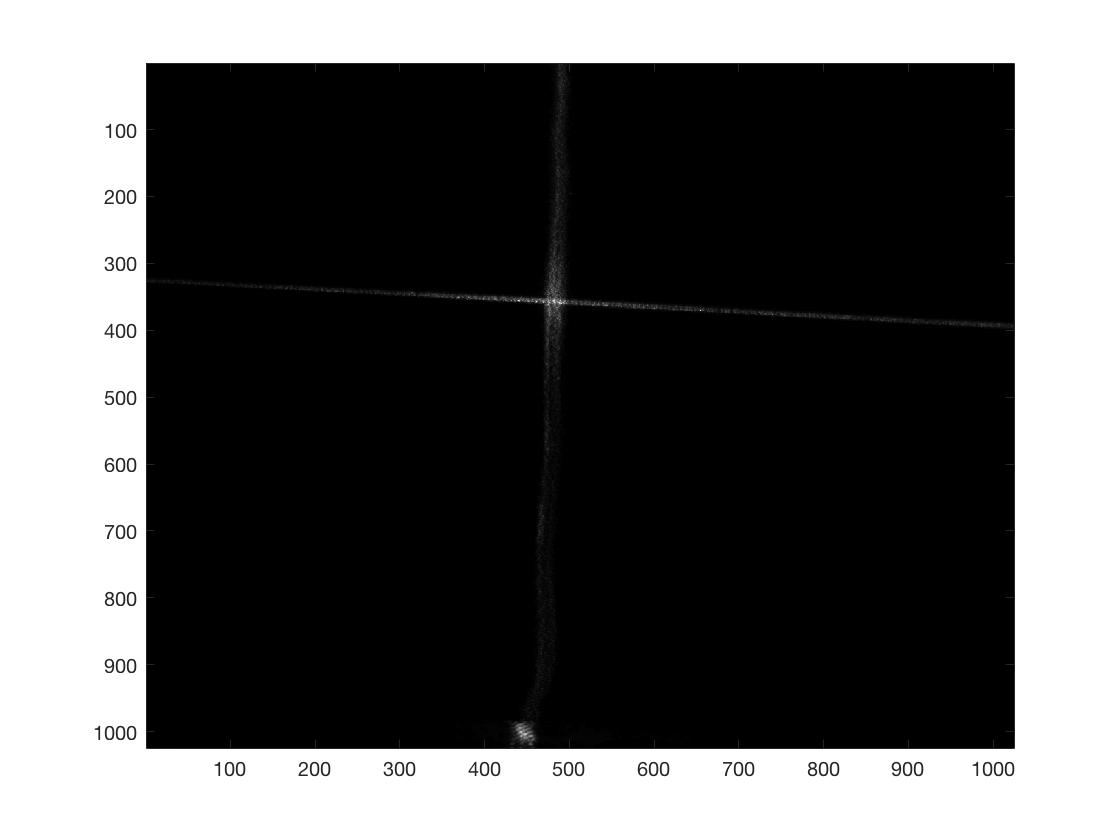
Figure 3: Test Image
The points illuminated by the laser were identified by setting a brightness threshold. These points on the control image are shown in Figure 4.
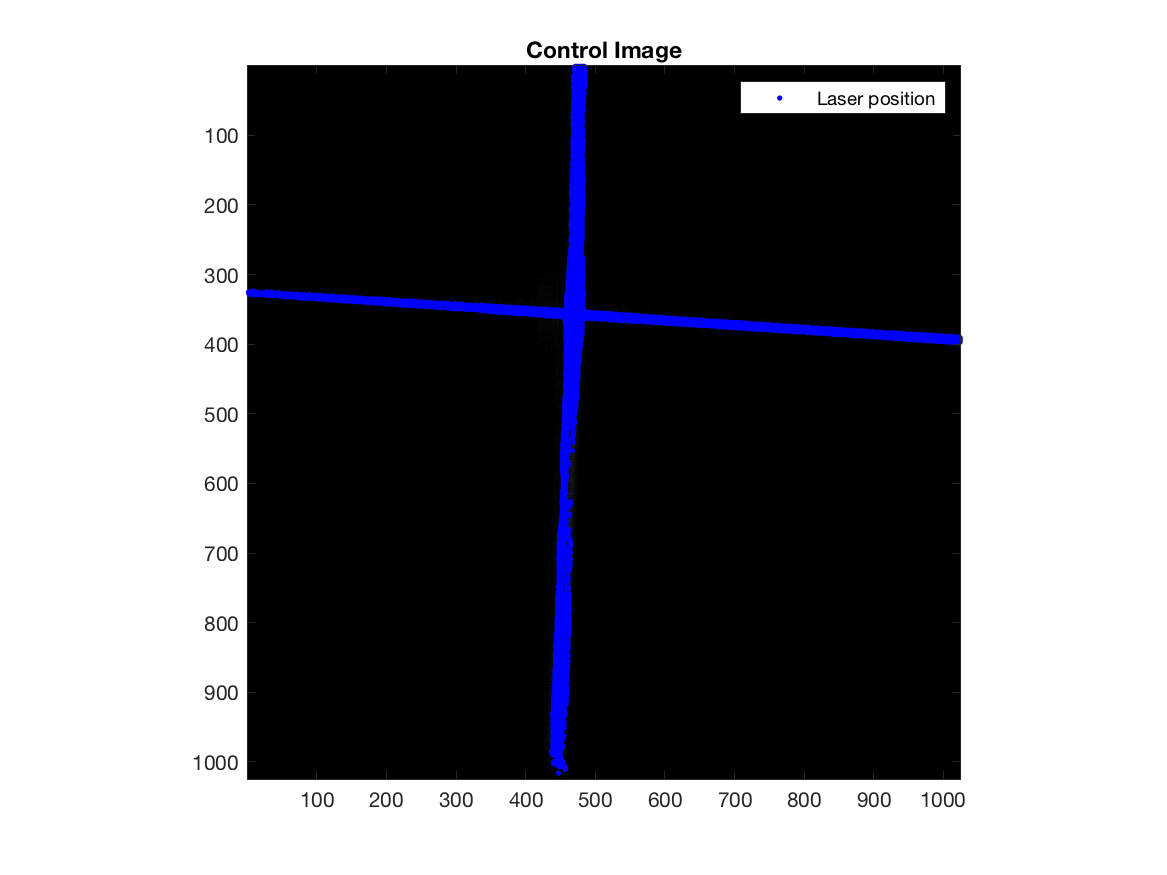
Figure 4: Position of the Laser Beam on the Surface
The points were then fed into the RANSAC fitting function, which was able to fit the best regression model based on the inliers shown below in Figure 5.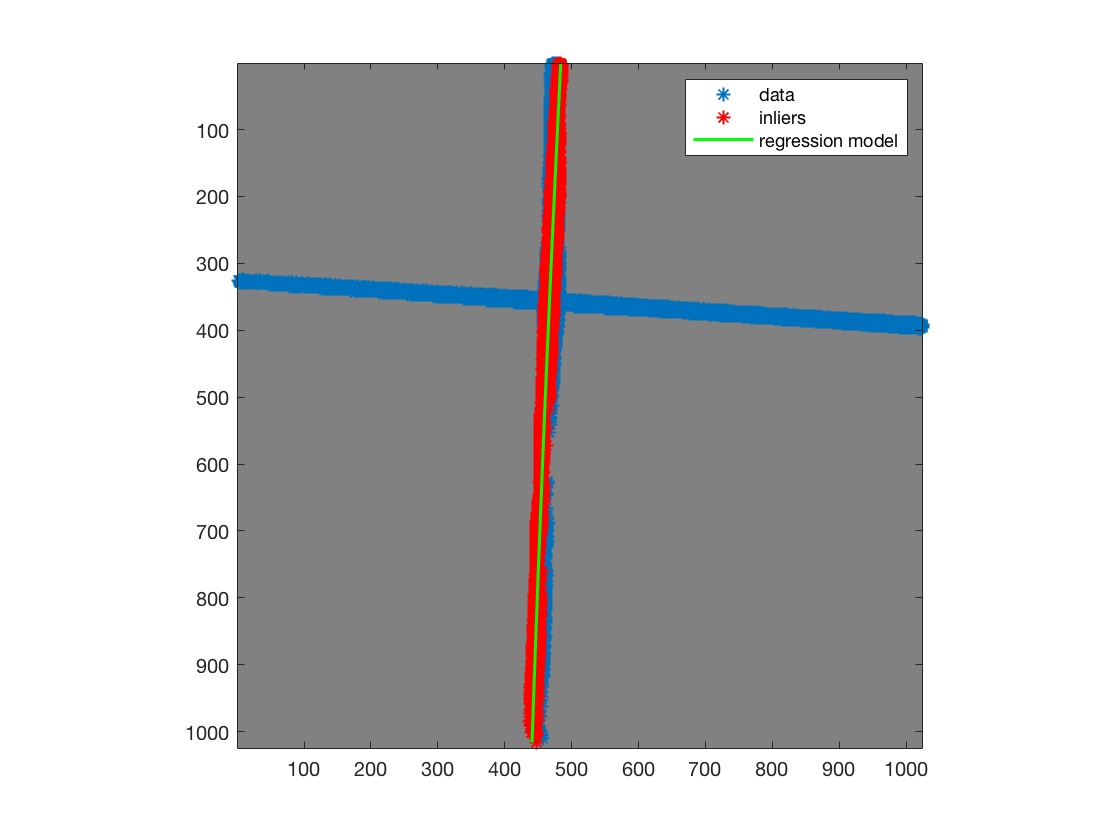
Figure 5: Curve Fitting using the RANSAC Algorithm
Figure 6 shows the fitted curve on the vertical laser beam for the control image. The same process was repeated for the test image. Figure 7 shows the fitted curve on the vertical laser beam for the test image. The shift in position of the laser beam due to flow is shown in Figure 8.
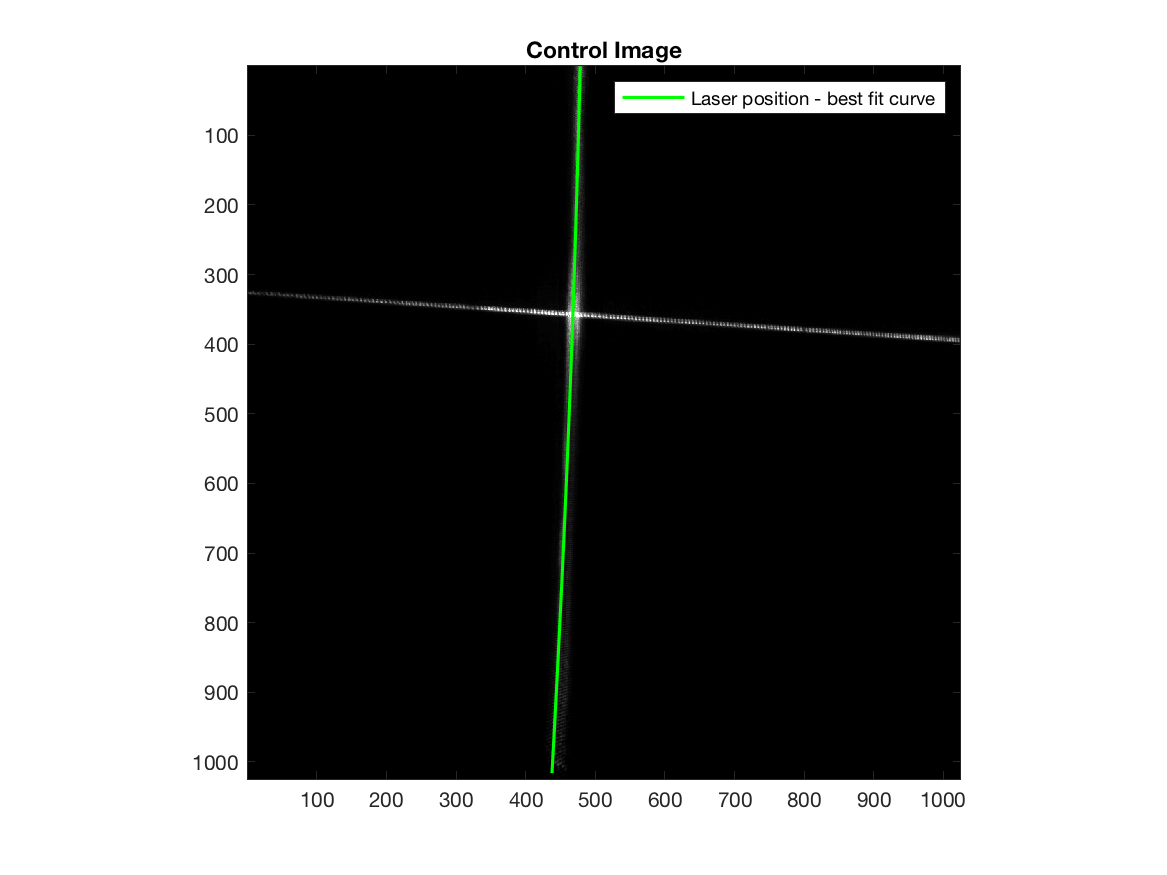
Figure 6: 2nd Order Curve Fitted to the Laser Beam on the Control Image
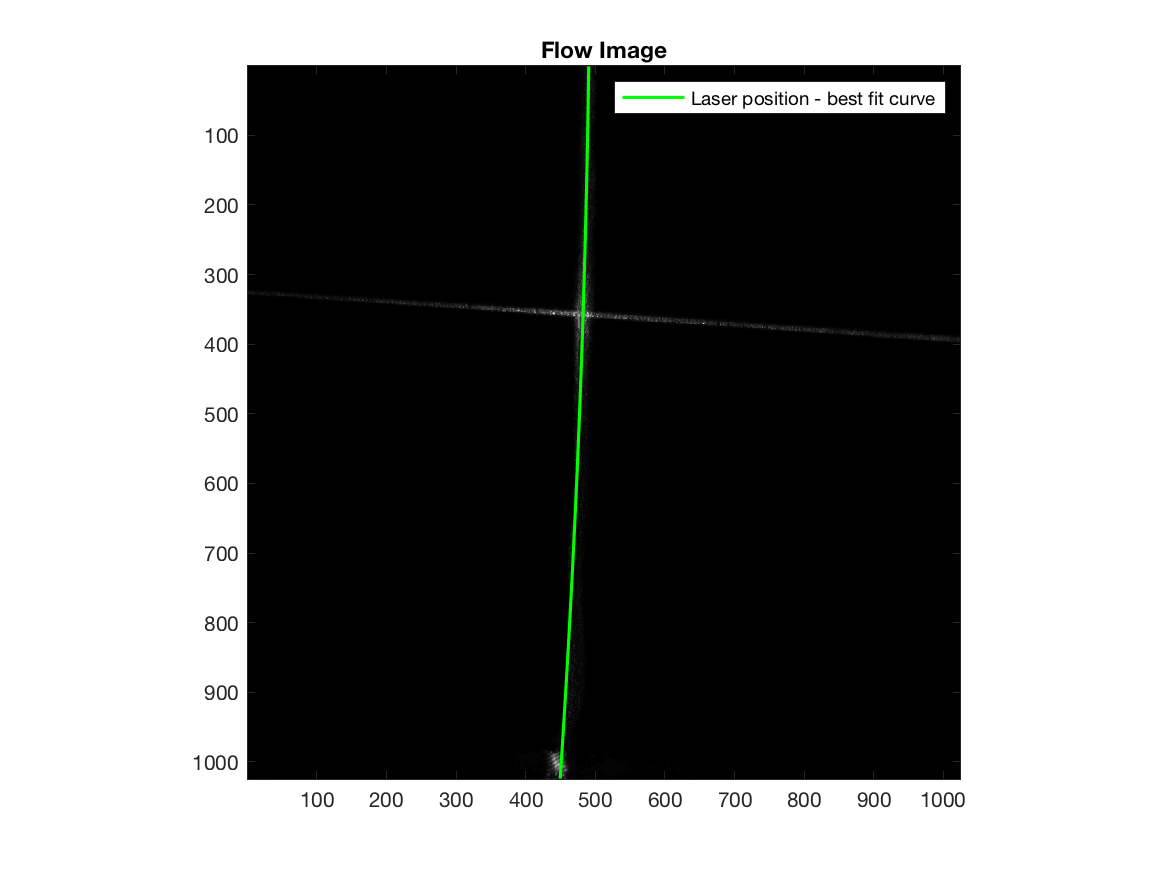
Figure 7: 2nd Order Curve Fitted to the Laser Beam on the Test Image
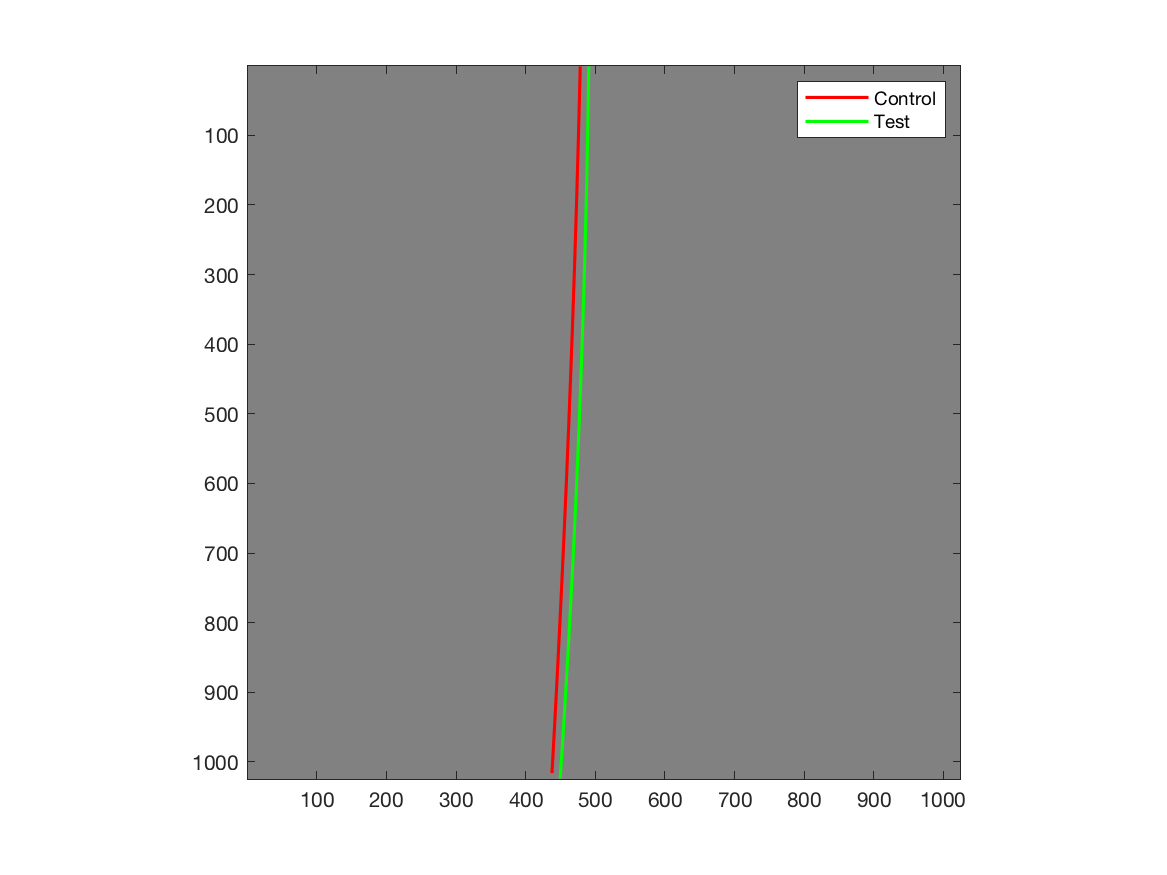
Figure 8: Shift in Position of the Beam due to Flow
The displacement of the laser beam with distance from the bottom of the image is shown in Figure 9. From this plot, the average displacement was calculated to be 13.79 px.
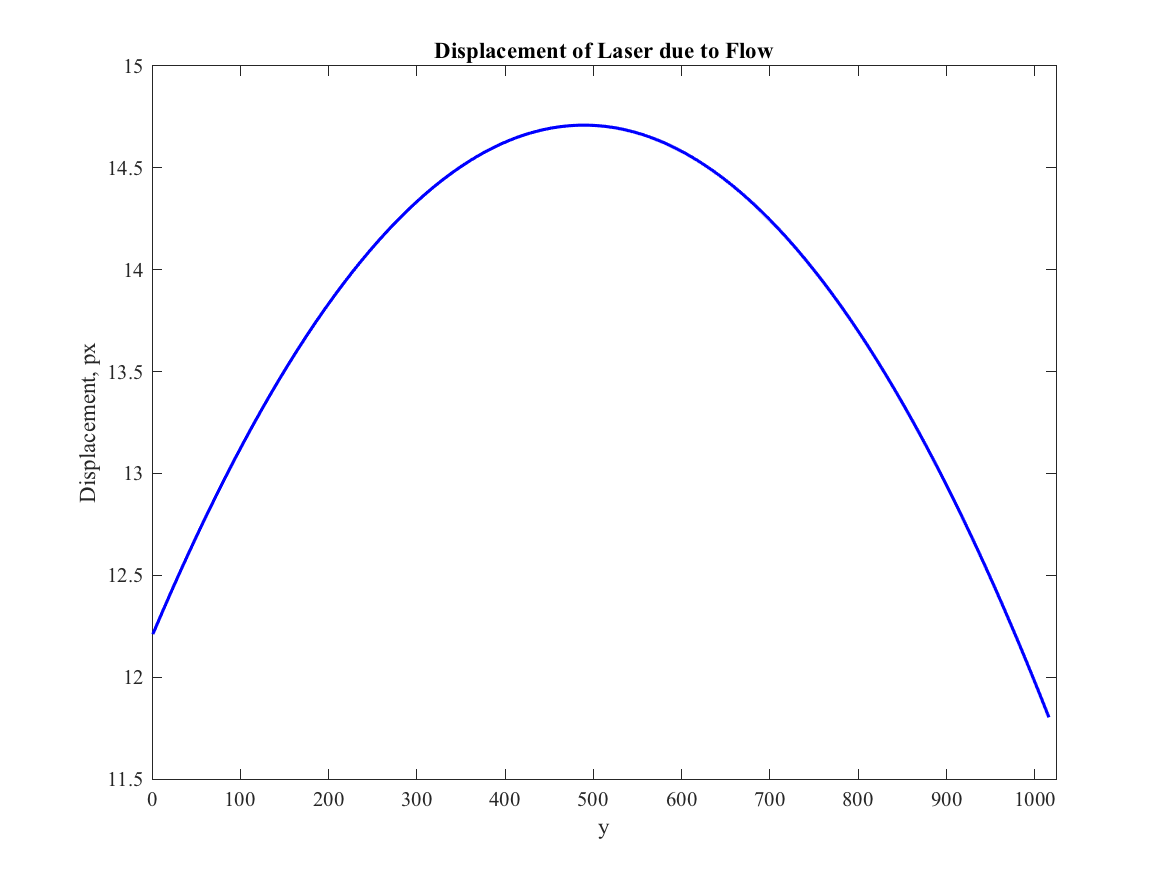
Figure 9: Shift in Position of the Beam due to Flow
A 2nd order curve was fit to the data because it seemed to better approximate the laser beam position compared to a first order fit. Although the RANSAC algorithm is able to estimate a good fit each time, it is important to note that the best regression model changes each time the function is run, because the model is based on a random sample each time. By increasing the number of iterations of the fit, the best model becaomes more consistent. In addition, the variation that this phenomenon causes in the average displacement value depends on the scale or resolution of the images.
Conclusions
The RANSAC algorithm was effective in fitting a curve to the vertical laser beam on the test and control images. A RANSAC algorithm was used because the data contained outliers. Fitting curves to the images before and after flow enabled measurement of the displacement of the laser beam during flow, which can be used to determine the height of the granular flow. However, this method causes variation in the value of displacement obtained for each run, because the best model is based on a different random sample each time.